
Explore some of Jim‘s features below, or see the full on-line Manual here.
To try out Jim free for 30 days, please go to the on-line manual, click on Chapter 2 (Installation) and see the section for your particular computer platform (Windows, Linux, Mac OS). You will have access to the full version of Jim, and full support for the trial period.
 Import DICOM, ACR-NEMA, Bruker, Agilent, Siemens, GE Medical Systems, Raw Data using the easy image import facilities. Automatically scans through your data folders to collate and structure your images.
Import picture formats such as JPEG, tiff etc.
Display all popular image data formats, including DICOM, NIFTI and Analyze 7.5. Easy mouse zoom and pan. Custom colour mappings. Line profiles and histograms. Orthogonal views and multi-planar reconstruction. Movie display. Linked displays, for simultaneous display of the same image with different contrasts.
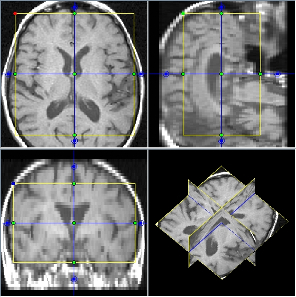
 Jim has all the tools you need to set your images up for analysis. Too many slices? Pull out just the ones you want. Resize the pixels, crop, pad, filter, set the dimensionality. Rotate and reorient. Fine tune the orientation with the multi-planar reconstruction.
 Registration is an important step in many image analysis pipelines, and Jim has the tools to do it! Both affine are non-linear (diffeomorphic) registration are available, allowing both intra- and inter-subject image alignment as well as registration to templates. There is also a special module for time-series registration to correct subject motion.
Interactive ROI creation. If you can use PowerPoint then you will already be familiar with the user interface to create and manipulate ROIs. Ten types of ROI to choose from, from simple Markers and Text Annotation to automatic contouring around image features. Easy editing drag handles and the eraser. Full ROI statistics: area, mean, median SD signal intensity; perimeter and Feret diameter. Region statistics and pixel intensities can be exported for analysis using your favourite spreadsheet. Regions can be used to mask images.
Images can be combined using pixel-by-pixel algebraic manipulations. A simple example would be to calculate the magnetisation transfer ratio from two input images (with and without saturation pulses). There is a set of ‘preset’ formulae for most of the common image manipulations. However, you can combine any number of images using any formula you can imagine – there’s no limit to the complexity of what you can calculate.
All the regular image ‘fitting’ routines that you would expect – such as T1 and T2 calculation, diffusion coefficients – but this is just the start. The flexible image fitting module can fit any function that you want. Just input the formula that you want to fit, tell Jim what are the fit variables in the formula, set the images you want to be fitted to and what are the independent variable values for each image. Then Jim will do the rest. It will produce one output image for each fitted variable, and will even allow you explore your data using the ‘Roaming Fit’ function – you can visualise the fitted curve for each pixel as you move the mouse over the image, or within regions-of-interest.
 Select image features based on their intensity and connectedness characteristics. Perform morphological operations, such as erosion and dilation. Create an image ‘mask’ from these features, and apply that mask to other images.
The Fuzzy Connector allows segmentation of image features based on their fuzzy connectivity – how the pixels ‘hang together’ in forming structures. A specialised version of this tool is formulated to find the extent of white matter disease in multiple sclerosis.
 Tools to segment the brain and spinal cord, both for assessing atrophy and for determining the tissue properties within these structures. Sophisticated brain atrophy assessment tool, with grey-matter, white-matter and automatic lesion segmentation and volume quantification. The brain segmentation is also built into may other tools for automatically calculating values only inside the brain and masking extra-cerebral tissues.
 This allows you to assess focal changes in the brain as they evolve over time. A typical use is to assess disease activity in multiple sclerosis, chronic ischaemia and other evolving diseases.
 Jim has several tools to assess your dynamically-acquired images. The Brain Perfusion and Dynamic Contrast-Enhanced MRI modules will be familiar to those who use injected contrast agents. The generic Dynamic Analysis module allows virtually any model to be fitted to time-series data, such as a traditional fMRI general linear model. But you can create your own ‘plugin’ analyses.
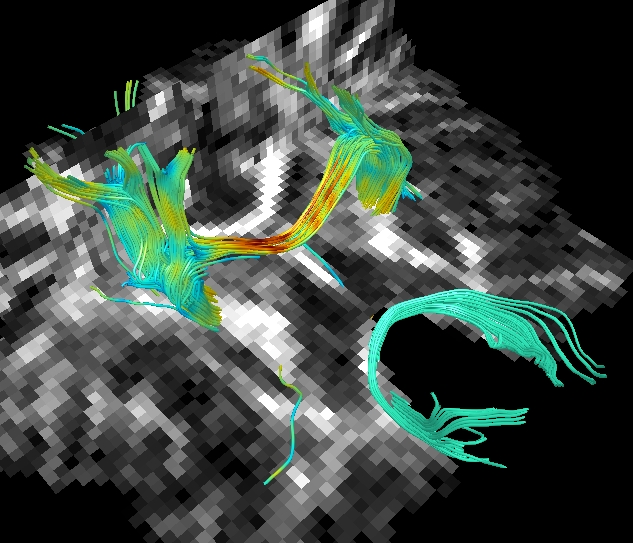 Jim includes a full diffusion tensor analysis and white matter fibre tracking module. This is integrated with the 3-D display so you can visualise the fibre tracts. You can load any of your images as orthogonal planes or 3-D surfaces, and you can also visualise regions of interest in 3D. Transparency and surface fidelity are all independently settable for every object loaded into the 3-D display.
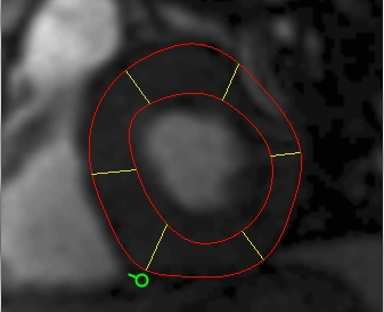 The myocardium segmental analysis module allows you define the inner and outer borders of the myocardium and then set the number of myocardium segments and the insertion point on each myocardial slice. The borders can be manually or automatically adjusted. Tissue properties in each segment can be assessed, and there are analyses for simple segment intensity extraction, and perfusion assessment from contrast-enhanced images. However, you can easily write your own analysis ‘plugin’.
The new ROI propagation module is useful for changes in shape through the cardiac cycle, for example to assess aortic distension and pulse wave propagation.
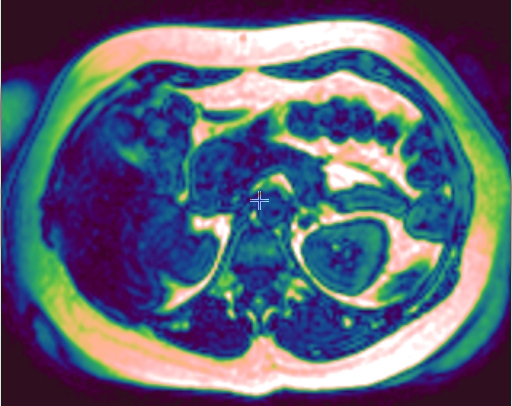 Fat-water separation module. From a set of MR gradient-echo images with different echo times, you can separate the signal into fat and water images. The module uses state-of-the-art methods to correct for B0 inhomogeneity and estimate the T2*.
 There are many other tools not listed here, and most users will have something to meet their needs. However, if you have some unusual requirements that are not met by the core package, you can extend Jim‘s capabilities either using an analysis ‘plugin’, or by writing your own piece of the analysis pipeline.
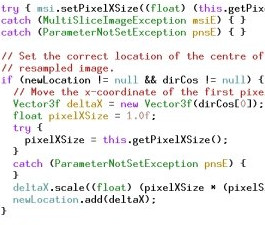
Jim comes with an extensive Java programming A.P.I. to give straight-forward access to the images, regions-of-interest and many basic manipulation and processing tasks. Access to this Java library is free and no purchase of Jim is necessary to use it.