Having performed the brain follow-up analysis as detailed in the Introduction, and Options sections, you can now review the output image for change.
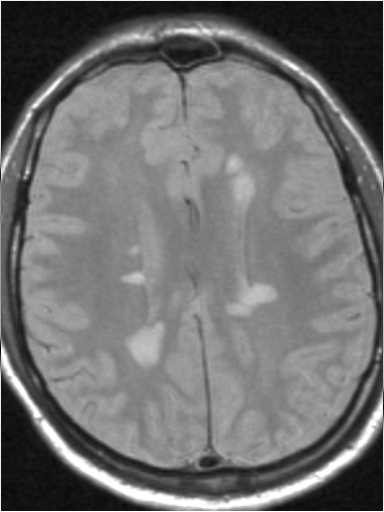
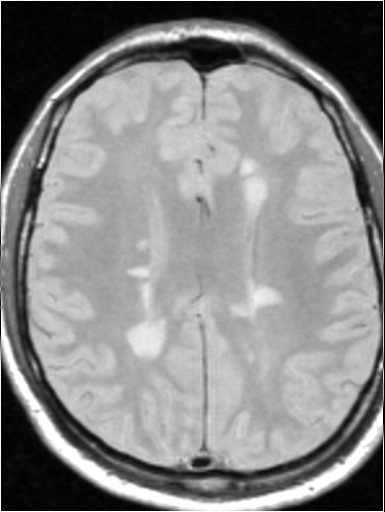
Several output images are created, with the number depending on the number of time points and image contrasts analysed. In this simple example, we analysed only two time points and a single image contrast (proton-density-weighted MR images). The input images are as shown below:
|
|
|---|---|
| Baseline | Two-year follow-up |
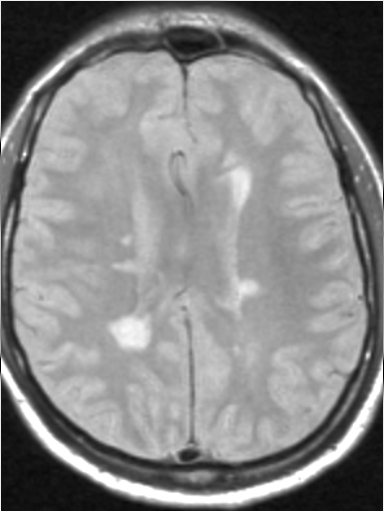
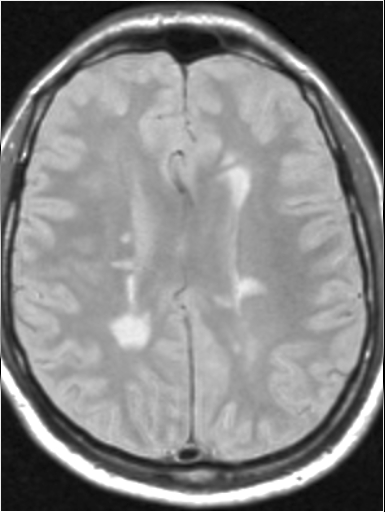
The Brain Follow-Up tool creates co-registered versions of each of the input images, with names equal to the input images, but with the prefix 'r'. These co-registered images are shown below:
 |
 |
|---|---|
| Baseline, after co-registration |
Two-year follow-up, after co-registration |
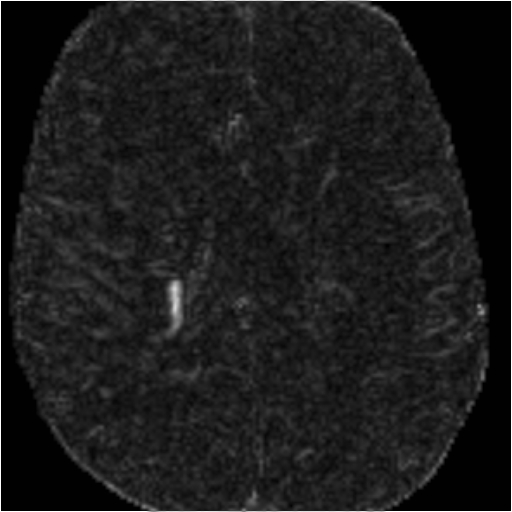 |
|---|
| Difference between the 2-year follow-up scan and baseline, after bias field correction. |
 , it is only possible to
distinguish between new and resolved lesions, and between enlarged and reduced lesions by
simultaneously looking at the difference image, together with the two registered time point images.
Review is greatly assisted by loading these three images into
linked, spawned
displays.
, it is only possible to
distinguish between new and resolved lesions, and between enlarged and reduced lesions by
simultaneously looking at the difference image, together with the two registered time point images.
Review is greatly assisted by loading these three images into
linked, spawned
displays.
 button. This will automatically load the difference image into Jim's main display, and the
registered time point images into two spawned slave displays. The
ROI Toolkits will also be
launched ready for you to make measurements of lesion volume changes on the registered images,
confirming the changes by referring to the difference image.
button. This will automatically load the difference image into Jim's main display, and the
registered time point images into two spawned slave displays. The
ROI Toolkits will also be
launched ready for you to make measurements of lesion volume changes on the registered images,
confirming the changes by referring to the difference image.
Note: you can only review the last set of results produced by the Brain Follow-Up tool in this way, and if you make any changes to the setup between performing the analysis and requesting the review, then the review may fail to display the correct images.