Writing Intensities
Pixel intensities within ROIs can be written to a disk file in a tabular format suitable for importing into a spread-sheet for further analysis. The format of a file is given in the file formats section, and is a space (" ") separated tabular format, with the intensity of each pixel within each ROI contributing one row to the table. The values written are the (x,y) location of the pixel and the intensity of that pixel; thus 3 columns are written. The (x,y) location may either be in mm or in pixels, depending on the setting of the display units.
The image is scanned from left to right and from top to bottom in a raster fashion, and pixel intensities for each pixel within the ROI are written in the order in which the pixels are encountered.
Note: coordinates and intensities are only written for pixels where at least half of the area of the pixel lies within the ROI.
A single & character on a line by its self
separates the intensities for different ROIs.
The first line of the output file consists of the header:
# x y intensity
In addition, each ROI may have an additional header:
- If the check-box
 to
the right of the
 Annotationin the "ROI Details" panel is checked, the ROI annotation will be written on a line by its self, before the pixel intensities, e.g.# My_ROI_Annotation - If the check-box
 to
the right of the
 Slicein the "ROI Details" panel is checked, the slice number of the ROI be written on a line by its self, before the pixel intensities, e.g.# Slice 10
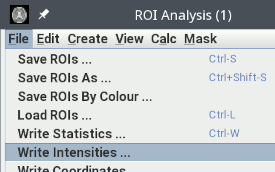
Write the ROI intensities using Write Intensities from the
File menu of the ROI Toolkit:
 ,
,
A File Chooser will prompt you for a file name into which to write the intensities (default extension ".txt"; default file name from the image name). If the file already exists, you will be asked whether you want to:
- Overwrite the existing file. The current set of intensities will replace those already in the file.
- Append the statistics. The current set of intensities will be appended to those already in the file.
- Cancel. Nothing is written.
The ROI Toolkit will now write the pixel coordinates and intensities for all pixels within the ROIs of the image, to the file.