ROI Propagation - Aortic Pulse Wave Velocity (PWV)
This third calculation allows the velocity of a pressure pulse wave (the pulse wave velocity) to
be calculated in a phase-contrast angiography image. The propagation delay between two regions of
interest is computed by examining the time/velocity profile in each region. The propagation delay
is estimated from the peak in the cross-correlation function between the two velocity profiles.
You can also use this tool to examine the volume flow rate through the cardiac cycle in the
vessels, although if this is the only thing you want to do, then you would be better using the
volume flow rate calculation (VFR).
In this example, we will use a single axial slice phase-contrast angiogram through the
ascending and descending aorta to calculate the pulse wave velocity (PWV) around the aortic arch.
An MRI phase-contrast angiography sequence results in both a magnitude image and a phase image;
the phase image is used to calculate the blood flow velocities, but we will use the magnitude
image to outline the ascending and descending aorta.
The phase image is shown as
a movie below.
Phase images have intensity ranges that map to phase changes of +π .. -π. The actual
intensity values that map to this phase range can be -4096 .. +4096 (typical of images from
Siemens MRI scanners), 0 .. +4096 or -3142 .. +3142 (typical of Philips images).
Jim can automatically convert from the image intensity values to phase values.
We will outline the ascending and descending aorta on a few of the magnitude cine frames,
propagate the ROIs to all time points and then go on to calculate the PWV.
Having loaded the magnitude image into Jim's main display, we launched the ROI Propagation
toolkit and, using Spline ROIs,
outlined the ascending and descending aorta at 4 time points: at the
beginning and end of the cardiac cycle, and two points around systole. One of these time points is
illustrated below:
Phase-contrast angiogram magnitude image, with ascending and
descending aorta outlines shown at one of the time-points
Initially, we used the settings:
- Number of shape coefficients = 4. The vessels have a simple outline shape, and 4 shape
coefficients is enough to capture the variations in shape.
- Changes are periodic with time. This is an E.C.G. triggered cine sequence, where the last
image frame joins back to the first at the end/start of the cardiac cycle.
- The number of time coefficients was not set manually.
However, these settings resulted in a 'bleb' forming on the ascending aorta in some of the image
frames, where the image contrast was poor, as illustrated below.
'Bleb' seen on the ROIs in some frames of the phase-contrast angio magnitude image
During the propagation, in some of the image frames, the contrast is not good enough to prevent
the ROIs from wandering from the outline of the aorta. This was corrected by manually setting the
number of time coefficients to 30. Running
the propagation again the resulted in a smoother transition from frame-to-frame, and the
outline of the aorta was then followed accurately across all frames.
Calculating the PWV
We will now go on to calculate the PWV of the aorta. Select the 'PWV' tab
in the 'Propagated ROI Calculations' panel:
Then set:
- The phase image in the image selection panel.
- (Optional) The magnitude image in the "Magnitude image" selection panel. You do not
normally have to select the magnitude image here. However, if you work with images from a
General Electric MRI scanner, then you will need to select the magnitude image; this is needed
in most cases to correctly convert from phase image pixel values to flow velocity.
- Either the R-R interval, or the time between individual frames of the angiogram
image. If you want Jim to get the time between individual frames from the phase image,
then select the
 check-box. If Jim
cannot find the time between frames from the image, then it will give an error, and direct you
to set the value manually.
check-box. If Jim
cannot find the time between frames from the image, then it will give an error, and direct you
to set the value manually.
- The velocity encoding factor (VENC) for the angiogram. The VENC is the maximum flow
velocity that can be encoded without phase wrap.
- The propagation distance around the aortic arch. In order to find this distance, you will
need to load an oblique sagittal image showing the arch in the main Jim display, and the
phase-contrast angiogram in the cross-reference image
display. With the cross-reference image location shown, you can now use
Open Spline ROIs
to draw the inner and outer borders of the lumen of the aortic arch, as illustrated below.
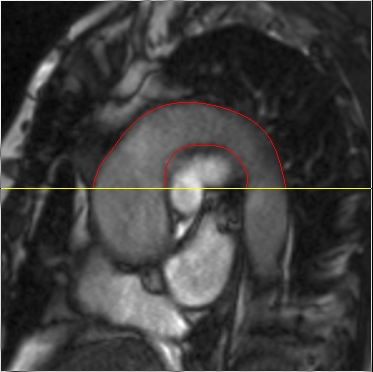
The inner and outer borders of the lumen of the aortic arch drawn as Open Spline
ROIs (red lines), in order to calculate the pulse wave propagation distance. The location of
the cross-referenced image is indicated by the yellow line. The cross-referenced image is
shown below.
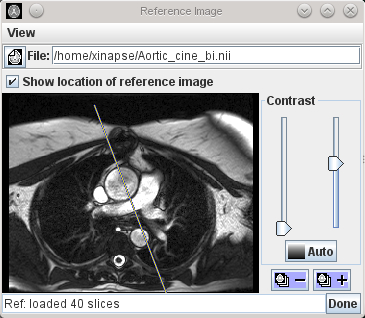
The cine magnitude image is loaded into the cross-reference display, to indicate the
location of the axial slice on the arch.
The propagation distance was calculated as the average of the lengths of the two ROIs
delineating the inner and outer borders of the lumen - this is the approximate length of the
mid-line of the aorta.
- Start frame and end frame. By default, this tool uses the velocity
waveform over the whole of the cardiac cycle to assess the pressure waveform lag. You can change
it to use only a certain range of frames of the cine sequence by entering the first and/or the last of
frame numbers that you want to use.
Click the
 button to start the area and
PWV calculation.
button to start the area and
PWV calculation.
First, the volume flow rate through each ROI is calculated over the cardiac cycle. A graph showing
the volume flow rate through each ROI then pops up:
Then a dialog pops up with a report on the calculated pulse wave velocity:
The dialog shows:
- The calculated time lag between the volume flow rate waveforms.
- The calculated pulse wave velocity.
- The maximum flow velocity (averaged over each ROI) through the cardiac
cycle.
- The maximum volume flow rate through each ROI through the cardiac cycle.
You can save these data to a report, either in plain text format, or in PDF format by clicking the
appropriate button.