Task-Based Help - MTR and MTR Histograms
In this example, we will process an fMRI data-set from a single subject acquired using a simple
on/off block-design activation task.
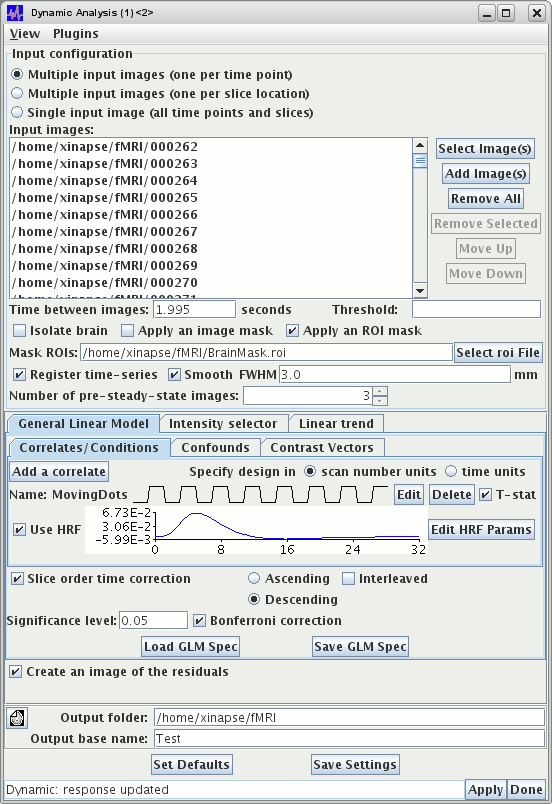
- Start the Dynamic Analysis tool, and select the
General Linear Model tab.
- Select the input image(s). In this example, each time point is in a separate image file, so
we selected the
 button. Then we selected the
  button, and
chose our input images. The file names are numbered in the right order, so the input images do
not need to be reordered using the
  or
or
 buttons.
- The time between images was set to 1.995 (which is the sequence repetition time), and we
created an ROI file containing
regions of interest that outlined the brain on every slice.
This ROI file (which we called BrainMask.roi) was selected as the mask.
- Since the subject moved slightly during the scan, we selected the
 check-box. We also provided a mild
spatial blur to improve the SPMs by setting the smoothing filter FWHM to 3 mm.
- The number of pre-steady-state images was set to 3, since the magnetisation has not reached
a steady state for the first three time-points, making them brighter than the rest of the images.
- The general linear model was set up to match the task. The task was a simple on-off
activation paradigm, with 8 images of rest followed by 8 images or stimulation, and the whole
cycle was repeated 8 times.
- The option to specify the design in "scan number units" was selected. The single correlate
was edited (press the
 button), choosing a
"Repeating Block" design.
The correlate was given the name "MovingDots", since this was the stimulus. Both the rest
duration and stimulus duration were set to 8 scans each, with the first period being a rest
period.
On the "Confounds" tab, a correction for linear drift was selected, with the number of
cycles for the Fourier basis functions set to 4. Since we have a total of 8 cycles during
the full stimulus/rest period, this will not filter out the required activation pattern.
-
If you want to use this setup repeatedly, or use it in batch processing, you can save it to an
XML disk file by pressing the  button
- We set a p-value of 0.05 for the significance level, and select the Bonferroni correction
check-box so that we can be more confident that we are seeing real activation in the T-statistic
SPMs.
- The output image base name was set to "Test".
The picture below shows the full set-up.

Pressing the  button results in the creation of
several output images, with name created from the base name "Test" set above, and the correlate
name "MovingDots". These are:
- TestMovingDots a map of the amplitude of the β value of this correlate.
- TestMovingDots-p a map of the p-value for the test that the amplitude of this
correlate is significantly greater than zero.
- TestMovingDots-T a map of the T-value for the test that the amplitude of this
correlate is significantly greater than zero.
- TestRMSE a map of the root-mean-square error between the fitted model and the data.
- Testresiduals the residuals over all time points (apart from the pre-steady-state
time points) after fitting of the GLM. This was created because we had the
 check-box selected. You would not
normally want to see this for fMRI analysis.
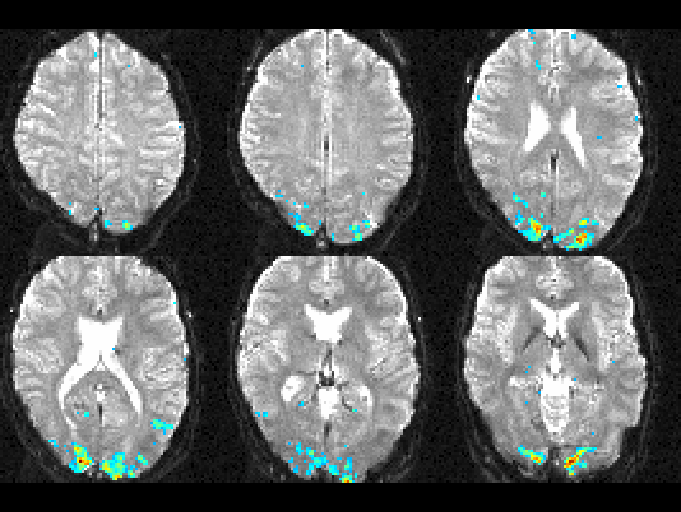
Below, you can see the T-statistic map overlaid on one of the input
images for a visual stimulation task.

T-statistic activation map overlaid on an fMRI input image.
 button. Then we selected the
  button, and
chose our input images. The file names are numbered in the right order, so the input images do
not need to be reordered using the
  or
or
 buttons.
 check-box. We also provided a mild
spatial blur to improve the SPMs by setting the smoothing filter FWHM to 3 mm.
 button), choosing a
"Repeating Block" design.
 button

 button results in the creation of
several output images, with name created from the base name "Test" set above, and the correlate
name "MovingDots". These are:
 check-box selected. You would not
normally want to see this for fMRI analysis.
