As you move the mouse pointer over the image, the slice number, position within the slice, and pixel intensity are shown at the bottom of the Image Display frame. See dimension display.
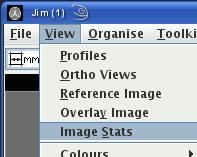
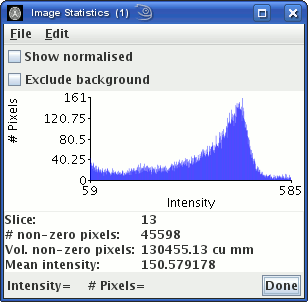
You can show statistics about the image in the Image Statistics
window. Click on Image Stats under the View menu:


If you select the
As the mouse is moved over the histogram graph, the intensity and number of
pixels at the mouse location are shown at the bottom of the
Image Statistics frame.
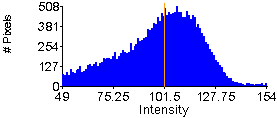
As the mouse is moved over the image, the intensity beneath the mouse
is shown as an orange vertical line on the histogram.
 check-box, then the number of
pixels on the y-axis is normalised so that the sum of all histogram y-values is
equal to 1.0. If you select the
  check-box,
then all intensities that are zero-valued will not be included in the histogram; more
specifically, the histogram bin that includes the zero value will not be included in the histogram.

For movies, the Image statistics for the visible slice is continuously updated as the movie steps through the frames.
To write the image statistics to a file, choose Write under
the File menu in the
Image Statistics frame: 
The image statistics file shows the number and volume of non-zero intensity image pixels in the loaded image or in the selected slice of the loaded image (if slice selected). If the image is not slice-selected, the number and volume of non-zero intensity image pixels (slice-by-slice) will also be shown in 3 columns. The three columns are the slice number, the number of non-zero pixels in that slice and the volume of non-zero pixels in that slice (in cubic mm). This is followed by the mean pixel intensity and the intensity histogram that is shown in the dialog.
An example of the format of the image statistics written to disk is shown below:
# Image stats written on "15 Dec 2013 13:24:35.321 British Summer Time" by Operator ID "xinapse"
# Build version="8.0_1"
# Image source= "/home/xinapse/images/A.PATIENT._001_STUDY_1_SERIES_6"
# Slice: None selected
# Number of non-zero pixels: 24821
# Volume of non-zero pixels: 2367.115 cu mm
# Slice n-non-zero vol-non-zero
1      6876     655.746459
2      4870     464.439392
3      2637     251.483917
4      2418     230.598449
5      2717     259.113311
6      2091     199.413299
7      1253     119.495391
8      760      72.479248
9      432      41.198730
10     305      29.087066
11     249      23.746490
12     66       6.2942504
13     147      14.019012
&
# Mean pixel intensity: 13342.382821
# Visible histogram:
118.0   0.0
119.0   0.0
120.0   0.0
...
The data intensity histogram is written in a tab-separated table with two
columns: the first is the pixel intensity value,
and the second is the number of pixels with that intensity. For
normalised histograms, the sum of all the values in the second column is equal to 1.0.
 , then, in
the next dialog, select the image file format you want.
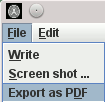
To write the image statistics histogram to a PDF, choose Export as
PDF under
the File menu in the
Image Statistics frame: 
A File Chooser will now pop up for you to select a PDF file to write the histogram and intensity statistics.
Click the  button when
you have finished with image statistics.