In order to illustrate use of the tool, we will use a single slice axial TrueFISP cine sequence (40 cardiac phases) through the ascending and descending aorta. This image is shown as a movie below.
Having loaded the image into Jim's main display, we launched the ROI Propagation toolkit and, using Spline ROIs, outlined the ascending and descending aorta at 4 time points: at the beginning and end of the cardiac cycle, and two points around systole. These are illustrated below:
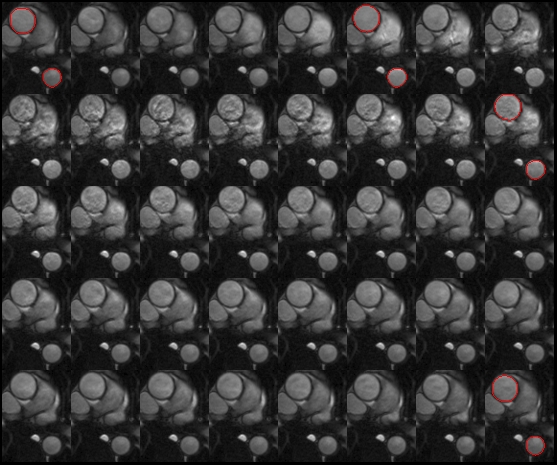
TrueFISP cine sequence with ROIs outlining the ascending and descending
aorta on four cardiac phases
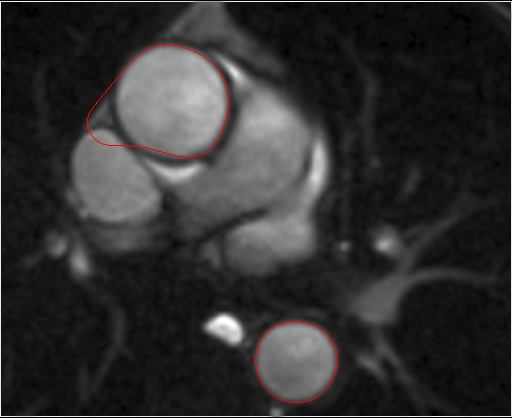
'Bleb' seen in some cine frames
ROIs propagated accurately across all cardiac phases.
Notice that even with only 4 shape coefficients, the outline can be accurately represented.
Click the
 button to start the area and
distension calculation.
button to start the area and
distension calculation.
The areas of the ROIs over time will be calculated, together the distension (maximum change in area / minimum area) for each ROI, and the results presented in a dialog:
You can save these data to a report, either in plain text format, or in PDF format by clicking the appropriate button.
Also, for each ROI, you will see a pop-up graph, like the one below, showing the area enclosed by the ROI through the cardiac cycle:
Finally, for each ROI, you will see a pop-up graph, showing the percentage change in area (distension) through the cardiac cycle for all the ROIs: