Roam ... from the View menu of
the Image Fitting tool:  . Both
the ROI Toolkit, and the Roaming Fit dialog will pop up.
Once you have set up the Image Fitting tool to perform a fit, instead of fitting to each image pixel individually, and creating output images of the fitted variables, you can perform more exploratory analysis interactively. You can:
The data and the fit are viewed on a pop-up graph.
First, set up the Image Fitting tool exactly as you would to perform a pixel-by-pixel whole image fit, as in sections 2-5. Next, load an image into Jim's display. The image you load can be any of the input images (or the input image if you have just a single input image).
To view the roaming fit, select Roam ... from the View menu of
the Image Fitting tool:  . Both
the ROI Toolkit, and the Roaming Fit dialog will pop up.

Then, either:
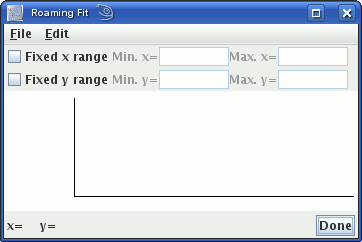
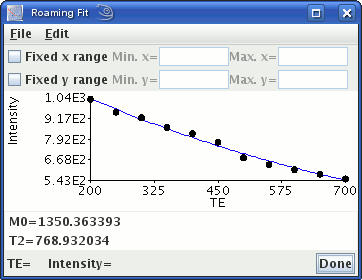
The fitted function will now be displayed in the Roaming Fit dialog.

The fit variable values are shown below the graph. Running the mouse over the graph will show the value of the fitted function at any independent variable (x) value.
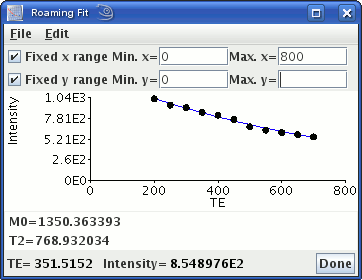
The circles show the data values, and the solid line is the function fitted. The x- and y- data ranges of the graph are automatically scaled to match the data. If you want to fix the range of data on the x- or y-axes, select the "Fix range" check box, and type in a range that you want to be displayed:

You can write the data and the graph to a disk file by selecting
Write from the File menu: 
First, the fit function and the fitted variable values are written.
Then the graph data is written in a tab-separated table with
two columns: the first is the independent variable value
and the second is the pixel intensity. Two tables are written:
first the intensity data from the input image(s), then the fit
function evaluated over 100 steps within the data range. See also
the File Formats section.
Note: If you change any settings in Fitter Dialog, you may need to de-select and re-select the ROI before the fitted graph is updated.