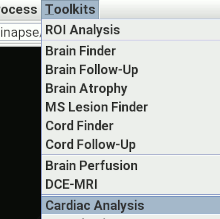
Toolkits menu:
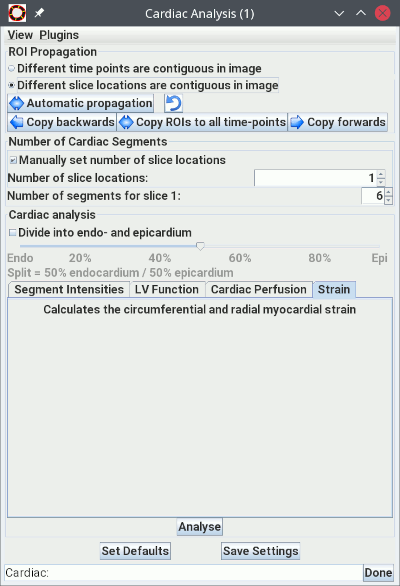
This will bring up:
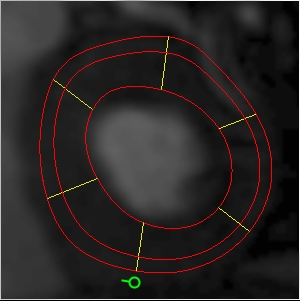
The Cardiac Analysis tool is a form of region of interest analysis that is tailored for analysing the myocardium. The left ventricular myocardium can be divided radially into a number of sections so that the different 'territories' of the myocardium can be analysed.
Typically, you will define the endocardial and epicardial borders using a pair of ROIs across a number of cardiac cine 'frames'. You will then tell the tool the number of segments, and indicate where the first segment should begin (the 'insertion point'). You can also optionally divide the myocardium into endocardium and epicardium. You can then perform of an analysis of the signal intensities in each of the segments.
Start the Cardiac Analysis tool from the Toolkits menu:
This will bring up:
 if the all the time points for the first slice are followed by all the time points for the
second slice, etc., or
if the all the time points for the first slice are followed by all the time points for the
second slice, etc., or if all the slices for the first time point are followed by all the slices for the second time
point, etc.
if all the slices for the first time point are followed by all the slices for the second time
point, etc.
When the image has been loaded, Jim will attempt to find from the image the number of
physical slice locations in the image. However, if Jim cannot find this, and incorrectly
sets the wrong number of slices, please set the number manually by clicking on the
 check box and altering the number of slice locations in the adjacent spinner.
Once the number of slices has been set correctly, you will see a spinner such as the one below for setting the number of myocardial segments for each physical slice:

Spinner for setting the number of myocardial segments - you will see one for each physical slice
location.
 check box. Selecting this enables the slider for selecting the percentage split between the endo-
and epicardium:
check box. Selecting this enables the slider for selecting the percentage split between the endo-
and epicardium:
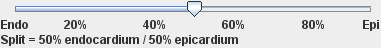
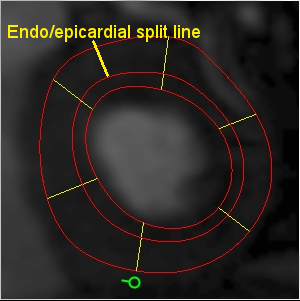
Slider to select the split between endocardium and epicardium.
 |
 |
|---|---|
| A myocardial split of 30% endocardium and 70% epicardium | A myocardial split of 70% endocardium and 30% epicardium |