Cardiac Segmental Perfusion Analysis
If your image time-series consists of a set of images showing the passage of a bolus of contrast
agent through the myocardium, you can perform segmental perfusion analysis. The perfusion
parameters will be assessed for each cardiac segment.
You will first need to defined the endo- and epicardial
borders at all time points, and set up the segments.
You will also need to provide an additional ROI at every time point that outlines the blood
pool in the left ventricle, as illustrated below:
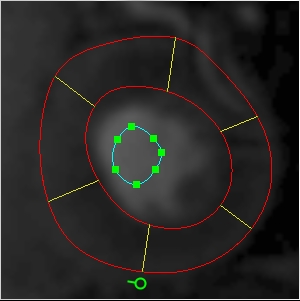
Additional ROI needed for perfusion analysis, outlining the blood pool in the left
ventricle. This is needed to calculate the arterial input function. This ROI is needed at every
time point in the time-series of images.
Select the "Cardiac Perfusion" tab in the Cardiac Segment toolkit:

You will then need to choose the following settings:
 . Select this check box if
you want to correct the signal saturation that occurs in T1-weighted MR
images. If you do not select this, the contrast agent concentration will be assumed to
be proportional to the image signal intensity change. If you do select this
option, this will bring up the following parameters to set:
. Select this check box if
you want to correct the signal saturation that occurs in T1-weighted MR
images. If you do not select this, the contrast agent concentration will be assumed to
be proportional to the image signal intensity change. If you do select this
option, this will bring up the following parameters to set:
- You can do the correction by setting the pre-contrast T1 relaxation
time of blood. Set the relaxation time of whole blood in milliseconds. You should use
literature values, for example 1650 ms at 1.5 Tesla, or 2020 ms at 3.0 Tesla.
- You can do the correction by entering a calibration factor (fully-relaxed signal
intensity). This value is output whenever you run a perfusion analysis while performing
the correction by setting the pre-contrast T1 relaxation
time of blood. You can use the calibration factor from a previous analysis done on the same
subject if the scanner has not recalibrated between scans. For example, in a stress/rest
protocol, you can perform an analysis of the stress perfusion using the relaxation time of
blood for calibration, and then run the analysis of the rest images using the calibration
factor found from the stress images.
- TRec (saturation recovery time). The analysis assumes that you are using a
saturation-recovery pulse sequence. Enter the recovery rime in milliseconds.
- Flip angle. Enter the readout pulse flip angle for the pulse sequence, in degrees.
- Number of lines to centre of k-space.
- Time between image frames. Jim does not automatically detect the time at which each
image frame is acquired. Instead, it assumes that the image frames are equally-spaced in
time. This time spacing is normally the nominal or average R-R interval. Set this is
milliseconds.
- Image frame at contrast arrival. This is the image frame number (numbered from 1) at which
the contrast agent is first seen in the blood pool in the left ventricle.
- Model. You can fit either:
- A one-compartment (single-exponential residue function) model. The output parameters
are plasma flow (F; units: ml/min/ml), distribution volume (vd; units: %)
and mean transit time (MTT; units: seconds).
- A Fermi residue function model. The output parameter
is the plasma flow (Fp; units: ml/min/ml).
If you choose the Fermi residue function model, you must also specify the image frame (time
point) number at which the minimum in signal intensity occurs between the first-pass peak
and the first recirculation peak. This is used to 'crop' the data so that only that
portion up to the recirculation is used in the analysis.
- Manually specify tissue lag. Jim will automatically attempt to determine the time lag
between the arrival of contrast agent in the left ventricle and the arrival in the
myocardium. However, if the results are unsatisfactory, you have the option to set the lag
manually. Select the check box, and alter the lag using the spinner. You can fix the lag
anywhere between zero and six image frames.
When you have the processing options set up, press the
 button. This will start the extraction of the image signal intensities, the correction for signal
saturation (if selected) and the calculation of perfusion parameters.
After a few moments, you will see a pop-up graph
showing the extracted contrast agent concentration values in each segment through the time series,
together with the fitted perfusion model. You will also see a dialog that shows
the calculated intensity calibration factor (that may be used in subsequent
analysis if you are running a rest/stress protocol), and asking
whether you want to save the results of the analysis to either a text or a PDF report:
button. This will start the extraction of the image signal intensities, the correction for signal
saturation (if selected) and the calculation of perfusion parameters.
After a few moments, you will see a pop-up graph
showing the extracted contrast agent concentration values in each segment through the time series,
together with the fitted perfusion model. You will also see a dialog that shows
the calculated intensity calibration factor (that may be used in subsequent
analysis if you are running a rest/stress protocol), and asking
whether you want to save the results of the analysis to either a text or a PDF report:
If you write a report, it will contain a table of calculated perfusion parameter values for each
physical image slice. Each table will contain a column for the perfusion parameter, and a row for
each cardiac segment. The rows are labelled S1 to SN, where S1 corresponds to the first segment,
and SN corresponds to the Nth segment. If you divide the segments into endo- and epicardium, the
table rows will be written as S1endo to SNendo, and S1epi to SNepi.
For a text report, the table will be in the form of a comma-separated list of values.